
World Rugby tracks time of possession for all World Rugby Sevens Series matches. Starting 7s recently published an analysis of time of possession data from the 2014-2015 series in order to understand its impact on 7s gameplay. The analysis considered:
This blog post discusses the article’s findings and shares some directions for future analysis.
New Zealand coaching legend Gordon Tietjens summarized the prevailing attitude towards possession best when he quipped “if you want to kick then do karate!”
The emphasis on ball possession — often at the expense of field position — is perhaps the most glaring tactical difference between 7s and 15s. In rugby 7s it is not uncommon for teams to attack from deep within their own half, often passing around or through their own goal posts rather than kick the ball to the opposition. Other 7s tactics such as the pocket pass and pull out intentionally lose ground in order to avoid tackles and the ensuing contest for possession. These tactics are rarely seen in 15s.
An analysis conducted by Starting 7s examines whether statistical evidence supports the commonly held beliefs about possession. Using time of possession data from the 2014-2015 World Rugby Sevens Series, the analysis uncovered the following items:
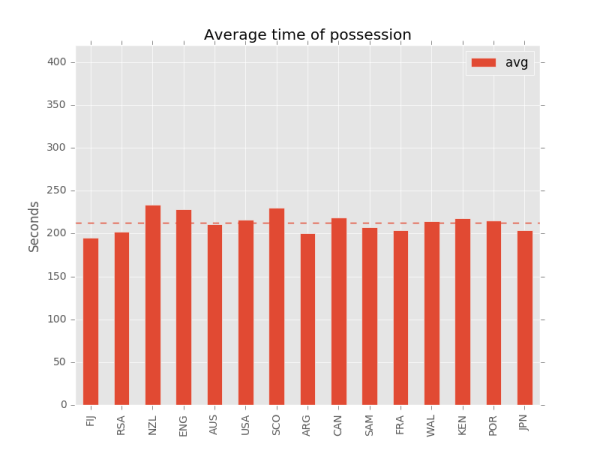
1. Teams averaged 206 seconds of ball-in-play possession and 18 points per match.
2. Series champion Fiji had the lowest average time of possession among core teams at 195 seconds per match. New Zealand had the highest average time of possession among core teams at 234 seconds per match and finished 3rd in the series overall. The range between the highest and lowest average time of possession was 39 seconds, a 17% difference.
3. There was little variation around the mean. All core teams had time of possession averages within 30 seconds of the series mean.
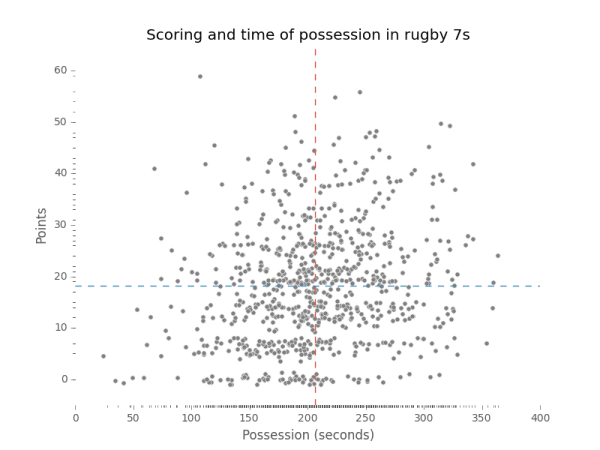
4. Although the series average scoring rate was roughly one try per minute of possession, individual match data did not show a strong relationship between possession and scoring. There was a lot of variation around the scoring mean. More than 30 teams held the ball longer than the series average yet failed to score more than 5 points. The highest match score — 59 points by New Zealand in the Gold Coast 7s match 11 versus Japan — was achieved in only 108 seconds of possession.
5. Possession differential — the difference between the winning and losing teams’ time of possession in a match — did not have a strong positive correlation with point differential. Across all matches the point differential had a correlation coefficient of 0.1786. Correlation coefficients less than .5 are generally classified as weak. This means that there is no strong evidence that holding the ball longer than the opponent increases the margin of victory.
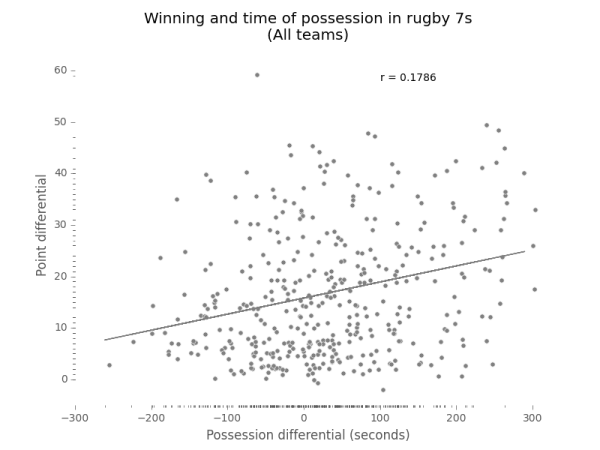
6. Win probability data supported the weak relationship between possession and point differential. Across all 405 series matches, 222 — or %55 — were won by the team with more possession. This is only slightly better than chance.
7. Non-core teams lost all 45 of the series matches they played. They also had a negative possession differential in all 45 matches. So the analysis was re-run with the non-core teams removed to check how their performance influenced the results overall.
8. When non-core teams were removed from the linear regression model the correlation coefficient between the point and possession differentials dropped to 0.1497.
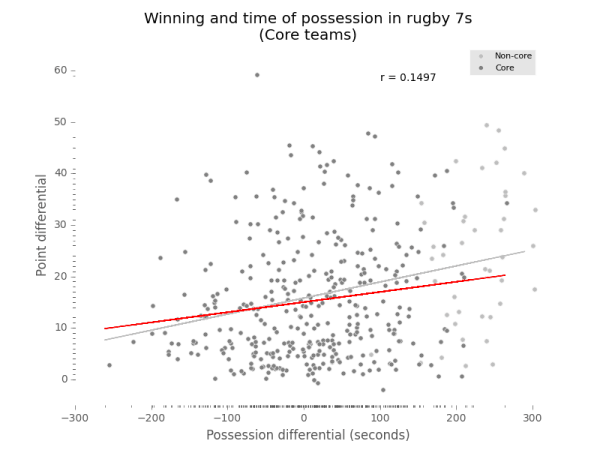
9. Across the remaining 360 matches, 191 were won by the team with more possession. With non-core teams removed from the analysis, the probability of the possession leader winning the match dropped to %53.
The analysis concluded the time of possession statistics do not offer strong evidence that having the lion’s share of possession confers a large advantage in a 7s match between evenly matched teams.
The World Rugby time of possession statistic do not seem to support the conventional wisdom about possession in rugby 7s. However, we should not conclude that possession is unimportant in rugby 7s.
More than anything the time of possession data reflects match tempo. The match tempo is no doubt influenced by the competitor’s styles of play. Fiji is known for their offloading and support game. By combining their ability to keep the ball away from breakdowns with finishing speed across the roster they can score a lot of points quickly. South Africa on the other hand uses aggressive work at the breakdown to generate short field tries off turnovers.
New Zealand plays a confrontational game that involves winning break downs, spreading the field, and keeping the ball for longer passages of play. Fiji and South Africa — the top series finishers — were among the lowest in average time of possession for core teams. New Zealand enjoyed the highest average time of possession and finished third overall in the series. The time of possession differences between these teams reflect their tactical and stylistic differences. But these statistics also show that pushing or slowing the tempo can be winning strategies.
A shortcoming of the study is that it only analyzes live ball time of possession. If we were to include dead ball time of possession the results may look very different. A winning team will often control the tempo of a 7s match by taking the maximum allowable time to kick conversions or restart play. Tactically kicking a penalty to touch when ahead is emerging as a standard tactic in 7s. A penalty kick to line out will improve field position while simultaneously — and perhaps more importantly — burning 90 seconds off the clock. But this type of possession is not captured in the live ball time of possession statistics tracked by World Rugby.
There are several interesting directions for future work. One area for future exploration would be to a collect a new statistic called dead ball time of possession. Another would be to examine which aspects of game play — such as rucks or passing — influence live ball time of possession. It would also be interesting to understand how 20 minute finals influence the live ball time of possession data tracked by World Rugby.

We design & manufacture premium nutritional supplements specifically for the rugby community. Our range of supplements can help professional and amateur rugby players alike to perform, recover and live better.
The materials and information provided in this presentation, document and/or any other communication (“Communication”) from Ruck Science, LLC or any related entity or person (collectively “Ruck Science”) are strictly for informational purposes only and are not intended for use as diagnosis, prevention or treatment of a health problem or as a substitute for consulting a qualified medical professional. Some of the concepts presented herein may be theoretical.
References to any non-Ruck Science entity, product, service, person or source of information in this or any other Communication should not be considered an endorsement, either direct or implied, by the host, presenter or distributor of the Communication. The host(s), presenter(s) and/or distributor(s) of this Communication are not responsible for the content of any non-Ruck Science internet pages referenced in the Communication. Ruck Science is not liable or responsible for any advice, course of treatment, diagnosis or any other information or services you chose to follow without consulting a qualified medical professional. Before starting any new diet and/or exercise program, always be sure to check with your qualified medical professional. For details of our affiliate program please see our Terms & Conditions. Click here for our Privacy Policy